Data Analyst

Professional Data Analyst Certification Program

Master the skills needed to become a professional data analyst and unlock the power of data-driven decision making.

Hands-on training with Python, SQL, and Excel for data cleaning, transformation, and analysis Applied statistics and predictive modeling to uncover insights and support decisions Data visualization and storytelling to present findings clearly to stakeholders
View Batches
Signature Learning Experience
Professional Data Analyst Certification Program
Share this course

Earn an industry-recognized credential and get access to mentor-led guidance throughout your learning journey.

4.7/5 Program Rating
1,769 Learners Enrolled
Intermediate Level
90 hrs Total Duration
English,Hindi Language
Program Overview

Experience a modern, outcome-driven curriculum

Built with industry mentors, this program blends immersive live sessions, simulation projects, and on-demand resources so you can master Mandarin Chinese with confidence.

This comprehensive course will equip you with the necessary skills and techniques to analyze data effectively. You will learn how to use various data analysis tools, understand statistical concepts, and present your findings in a clear, actionable format.

Why learners love this program

Each element is crafted to accelerate fluency, cultural context, and career readiness.

  • Hands-on training with Python, SQL, and Excel for data cleaning, transformation, and analysis
  • Applied statistics and predictive modeling to uncover insights and support decisions
  • Data visualization and storytelling to present findings clearly to stakeholders
Lectures
45
Guided Hours
90 hrs.
Program Investment
₹29,500
Learning Outcomes

Unlock the capabilities that matter in real-world communication

Every module stacks practical language skills with cultural fluency, so you can speak confidently in professional, academic, and social settings.

Understand the end-to-end data analysis workflow: problem framing, data collection, cleaning, analysis, and reporting.
Perform data cleaning and preprocessing, including handling missing values, outliers, and transforming variables.
Extract, join, aggregate, and manipulate data using SQL for relational databases.
Use Python or R (pandas, dplyr, tidyverse) for data wrangling, analysis, and scripting reproducible workflows.
Conduct exploratory data analysis (EDA) to identify patterns, trends, correlations, and anomalies.
Apply core statistical concepts: probability, distributions, hypothesis testing, confidence intervals, and regression.
Build and evaluate predictive models with regression, classification, and baseline machine learning techniques.
Design and analyze experiments and A/B tests to support causal inference and decision making.
Create clear, effective visualizations and interactive dashboards using tools like matplotlib, ggplot2, Tableau, or Power BI.
Communicate findings and tell data-driven stories that lead to actionable business recommendations.
Implement version control (Git), documentation, and reproducible practices for collaborative analytics.
Ensure data governance, ethics, and privacy best practices when working with sensitive information.
Automate reporting and operationalize analyses with pipelines and scheduled processes.
Translate business questions into analytical solutions and collaborate effectively with stakeholders.
Define, measure, and monitor key performance indicators (KPIs) and track model/dashboard performance over time.
Certificate

Certificate You'll Receive

Earn an industry-recognized certificate upon successful completion of this course.
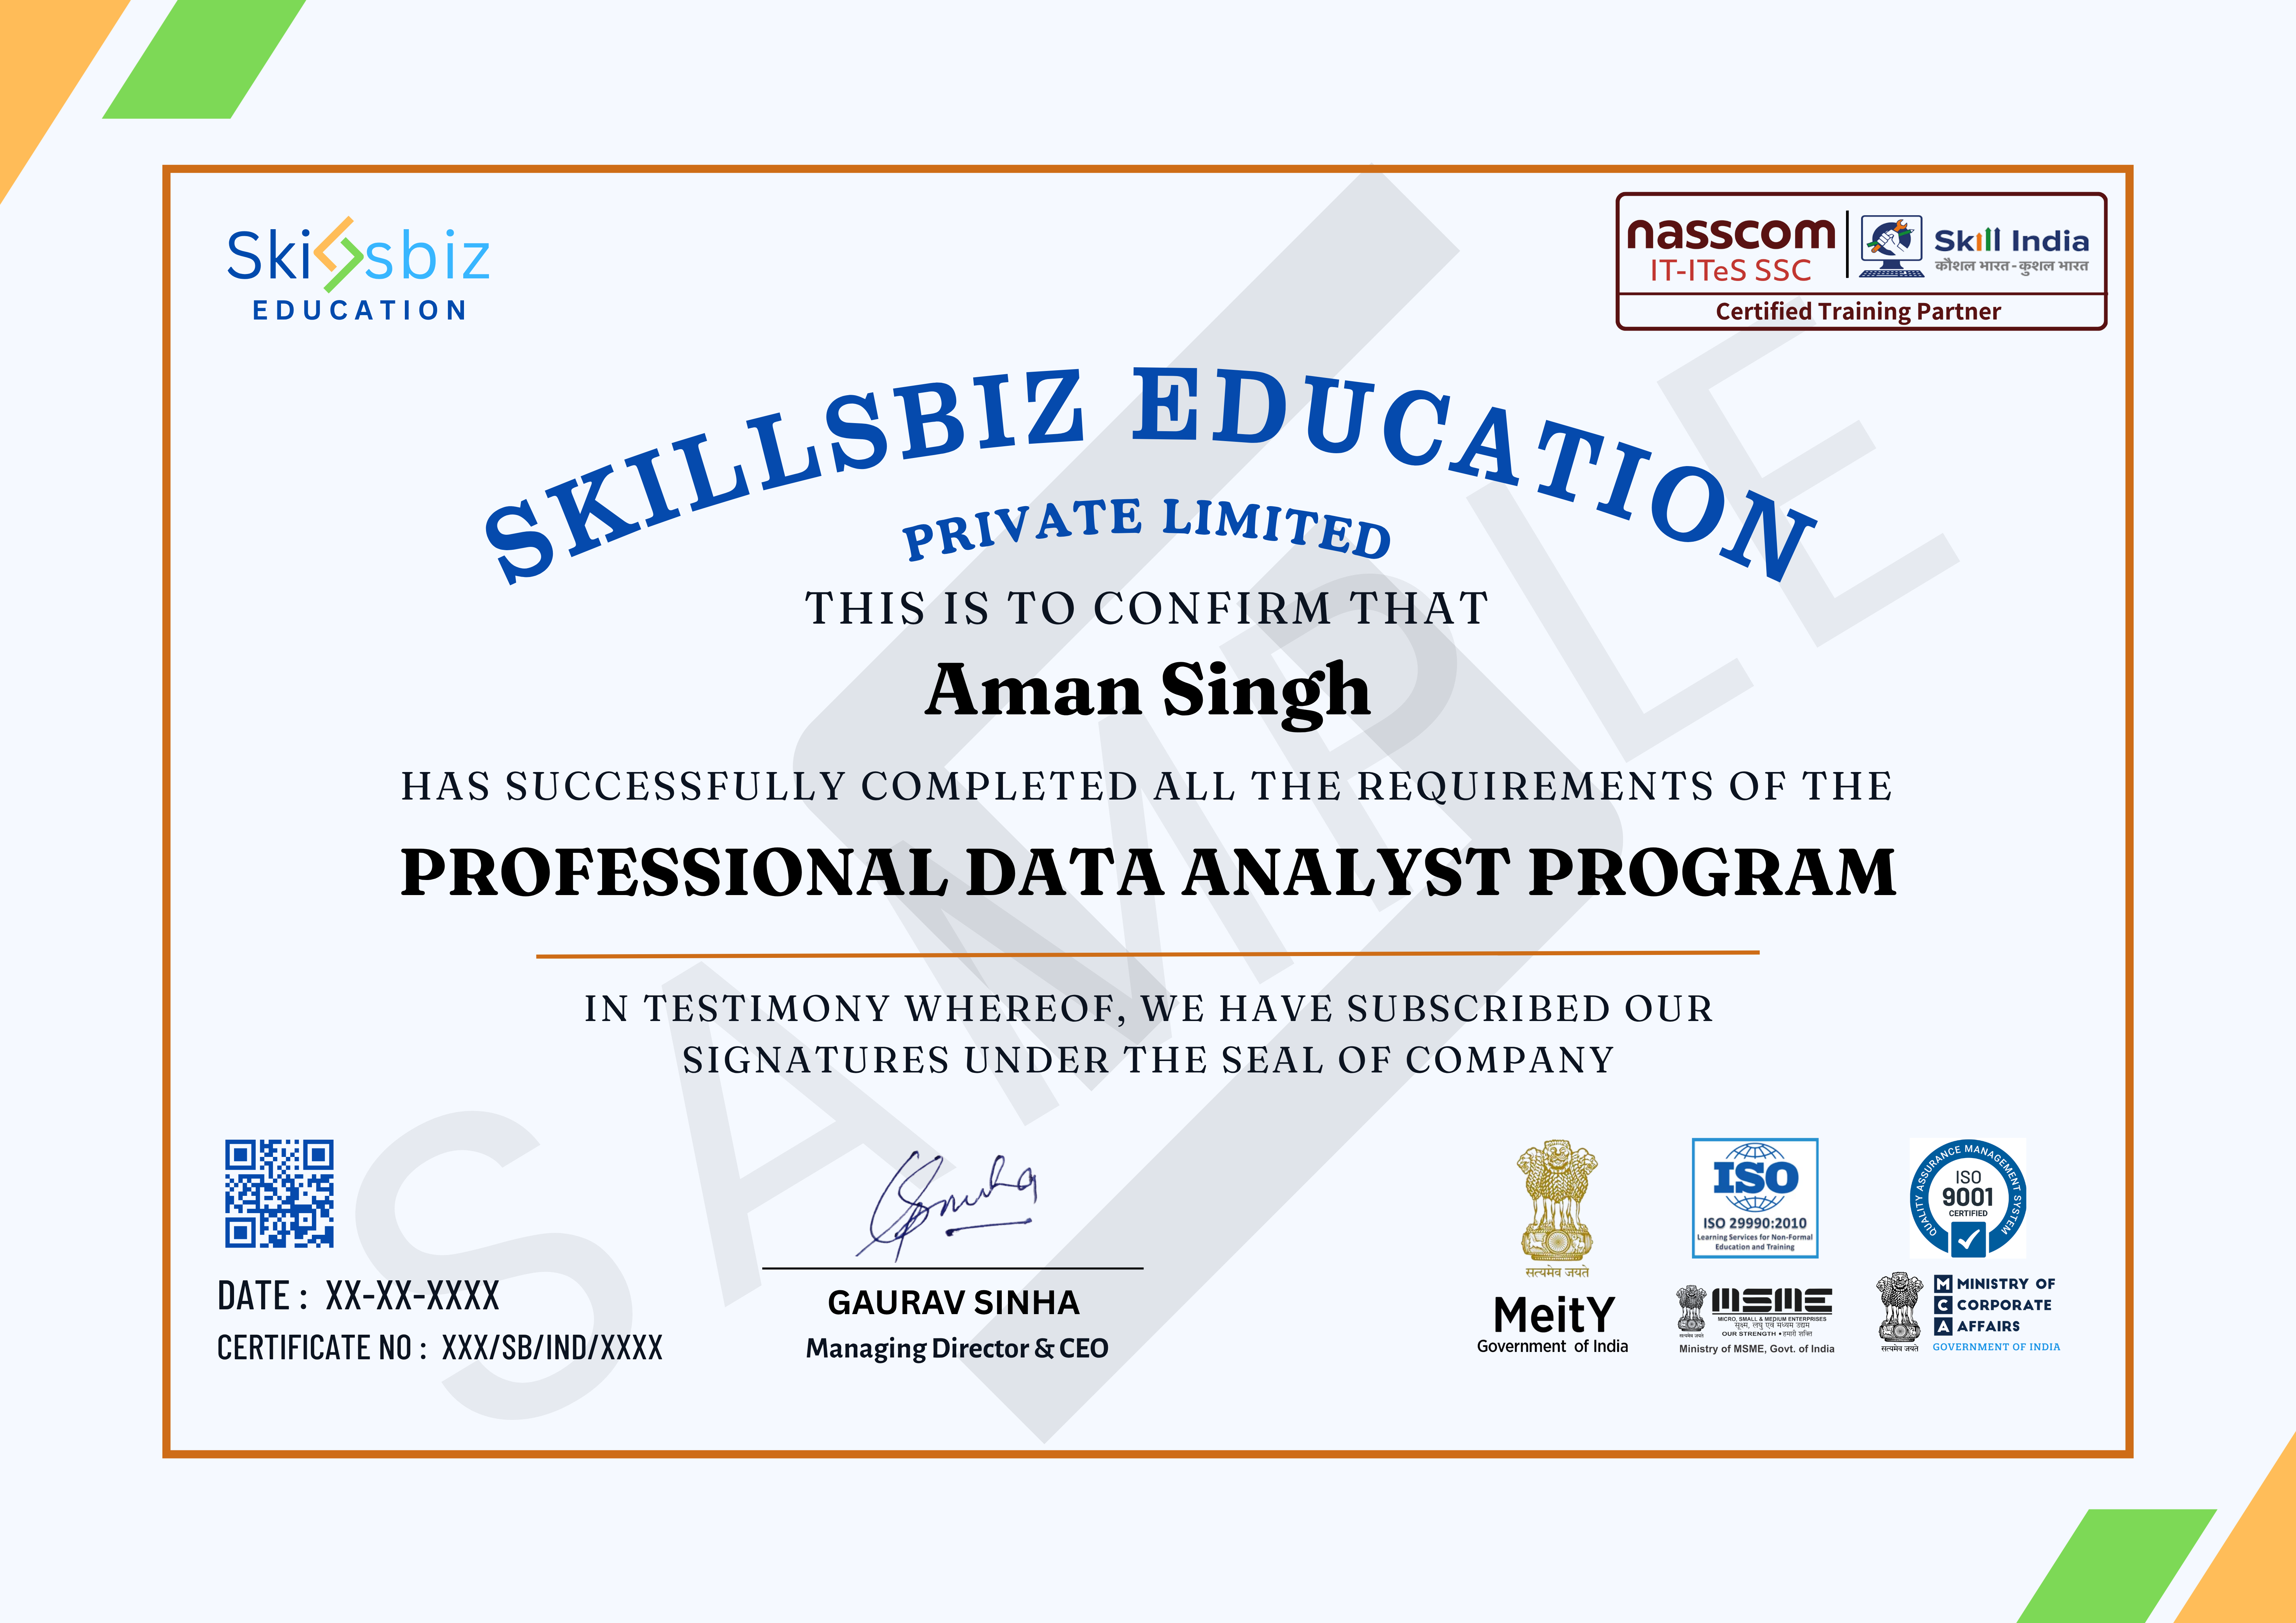
Professional Data Analyst Certification Program — Course Certificate
Personalised guidance

Book a discovery call with our program specialists

Get tailored advice on learning paths, certification journeys, and industry opportunities before you enroll.

In a focused 20-minute consultation we map your current proficiency, clarify where you want to get to, and suggest the quickest route to fluency with milestones we can help you hit.

  • Understand the skill gaps holding you back and the modules that can close them in the next cohort.
  • Get a personalised cohort recommendation based on availability, trainer profile, and your weekly bandwidth.
  • Discover global project work and certification add-ons that enhance Mandarin credentials on your CV.

Reserve your slot

Share your details and we will connect within 24 hours to set up a personalised walkthrough.

Curriculum Architecture

Structured modules that build fluency session after session

Explore the complete roadmap—from foundational vocabulary to advanced professional expressions—crafted with practical immersion in mind.

What is Data Analysis?
Define data analysis and explain its role in decision making. Identify common stages in the data analysis workflow.
  • https://docs.google.com/presentation/d/e/2PACX-1vT1I9wS-QW_0OC2AQ9E1VUJvllEKZBT6JRYUD9fAgDXvUK9rvdgnUCr-apDhsTWFQ/pubembed
2.00 hrs
Types of Data
Differentiate between qualitative and quantitative data and recognize common data types. Explain how data type influences analysis methods.
  • https://docs.google.com/presentation/d/e/2PACX-1vTVyt7EshA7APonjkPqtMkRe1qsE92Bo6OgqjQpcKWMcswZg-AohY8btqE-qGgFLg/pubembed
2.00 hrs
Data Collection Methods
Describe primary and secondary data collection methods and their appropriate uses. Evaluate strengths and limitations of common collection techniques.
  • https://docs.google.com/presentation/d/e/2PACX-1vTepKyUNGMSoYA1LxwMORhdbiZlEKBjj61Q8Mwveefy7wSzUbHODZ20_J4YnWhGIw/pubembed
2.00 hrs
Overview of Analysis Tools
Survey popular data analysis tools and platforms and summarize their typical use cases. Compare tool capabilities to select appropriate tools for given tasks.
  • https://docs.google.com/presentation/d/e/2PACX-1vQgNebI4oWe_AQhUp3JGlFrsHGS29uhr0Nh1YbNILpKgZItsBgsIAQPhXvxH-nFSA/pubembed
2.00 hrs
Data Quality and Cleaning Basics
Explain the importance of data quality and common issues like missing or inconsistent values. Apply basic cleaning strategies to prepare data for analysis.
  • https://docs.google.com/presentation/d/e/2PACX-1vT8l6nfwoUJiJWeE-T2u2oqlzs9iHHs2ZhB4TuZUEHtYNnxvH5aKfoTEtgwmniF7Q/pubembed
2.00 hrs

Descriptive Statistics Fundamentals
Calculate and interpret measures of central tendency such as mean, median, and mode. Use these measures to summarize dataset characteristics.
  • https://docs.google.com/presentation/d/e/2PACX-1vQy41z0KuczKJVc1vXbM-dzJVqHEpIiCzi_CucFimABJ7AexKDOTLpVQjCu0vDjRQ/pubembed
2.00 hrs
Measures of Dispersion
Compute and interpret variance and standard deviation to assess data spread. Explain how dispersion informs data interpretation and comparison.
  • https://docs.google.com/presentation/d/e/2PACX-1vS6EOIAnPb-IKfMuzuz05-TuOllwfz9NzguxqLnbSgIfDJVHL3JZPoQ74HG7pfX1w/pubembed
2.00 hrs
Distributions and Normality
Recognize common probability distributions and assess normality in datasets. Explain implications of distribution shape for statistical methods.
  • https://docs.google.com/presentation/d/e/2PACX-1vR3X7eGcaIj474-ljfb2RkhJgmYD1tezuzf7rS9eFQ4FEEU-6V_df0ErPexXYyo2Q/pubembed
2.00 hrs
Sampling and Estimation
Describe sampling methods and the concept of sampling error. Use estimation principles to derive population inferences from samples.
  • https://docs.google.com/presentation/d/e/2PACX-1vT1aBK7wSrKislqWAfcK4MmTxclEFXwH2f6Wy25sovN2uG9KmsjbOa35UM7ib8SGg/pubembed
2.00 hrs
Hypothesis Testing Basics
Formulate null and alternative hypotheses and explain p-values and significance levels. Conduct basic hypothesis tests and interpret results.
  • https://docs.google.com/presentation/d/e/2PACX-1vRTNYTiX3-MKqw4MpytoGjcPIog8wPkT5B0ASJ0L7sY1Ujj__s_Eoj61m4oHQYk9A/pubembed
2.00 hrs
Correlation and Causation
Measure and interpret correlation between variables and distinguish correlation from causation. Evaluate the limitations of observational data for causal claims.
  • https://docs.google.com/presentation/d/e/2PACX-1vQXGuwStKvx3S18kvDkrtFIJTQC80XEVbQTwdlzeLywk8xZU50XW-xBLUT8VbUv7Q/pubembed
2.00 hrs

Principles of Effective Visualization
Apply design principles to create clear and accurate visualizations. Identify common visualization pitfalls and how to avoid them.
  • https://docs.google.com/presentation/d/e/2PACX-1vSVU0D4WKChpWQ9L_uC69tX6xxlcXzhCrQiHe6xCt1uVP4SBVoI0ePviZWSotEhNQ/pubembed
2.00 hrs
Chart Types and Uses
Select appropriate chart types (bar, line, scatter, histogram) based on data and analytical goals. Explain when each chart best communicates specific insights.
  • https://docs.google.com/presentation/d/e/2PACX-1vTzQxjeXi6Go1yxo33zscMo8WSZRodzwaRoQ5vieeg-2ln5y7OWIjtzD5thj-_zPA/pubembed
2.00 hrs
Visualization Tools and Libraries
Compare visualization tools and libraries for different environments and audiences. Demonstrate basic chart creation using a standard tool or library.
  • https://docs.google.com/presentation/d/e/2PACX-1vQZt-jzP3RQ2SHqIlDkgBe1AWrOyR5SVkECDnGKRQheT4APtnkMWqflAqXgmpxSdQ/pubembed
2.00 hrs
Dashboard Design and Storytelling
Design dashboards that highlight key metrics and support decision making. Use narrative techniques to present data insights coherently.
  • https://docs.google.com/presentation/d/e/2PACX-1vSk_F9wBpYDMbZmGag1UZeBsj3SqpwT7GY9FKAYHMgAQZ0wIArmyVu0PVBI2600bg/pubembed
2.00 hrs
Accessibility and Ethics in Visualization
Ensure visualizations are accessible and avoid misleading representations. Apply ethical considerations when presenting and sharing data visuals.
  • https://docs.google.com/presentation/d/e/2PACX-1vT6UCZI7alq-1nhb_Fi7LYZIWPKIzqpt6Rys3llX4_uCJIBhfMxKUVQZJ00r1GrZg/pubembed
2.00 hrs

Python Basics for Data Work
Write basic Python code and use core language constructs relevant to data tasks. Manage data types and control flow for simple scripts.
  • https://docs.google.com/presentation/d/e/2PACX-1vTV9JMW7ghNnkhVbkdaiW21gsiD9ofmGKZFEmsuQAz_t8xJaeL-eiSnwSWbMkPLew/pubembed
2.00 hrs
NumPy for Numerical Computing
Use NumPy arrays for efficient numerical operations and array manipulation. Apply vectorized computations to speed up data processing.
  • https://docs.google.com/presentation/d/e/2PACX-1vT6CbzobImEh1XX_qYlusU7vNdDwquBJ15geYhC-1zk9Om85-WzfQrFw7dIP98vAw/pubembed
2.00 hrs
Pandas for DataFrames
Load, inspect, and manipulate tabular data using Pandas DataFrame operations. Perform filtering, grouping, and aggregation for analysis tasks.
  • https://docs.google.com/presentation/d/e/2PACX-1vS41SUzT8QdpG_tpjKpJurT_vOxk1rkFRCEWN_uEYSJXg9dkKbAEM3tZtzBVJw6ZQ/pubembed
2.00 hrs
Data Cleaning with Python
Identify and handle missing or inconsistent data using Pandas methods. Apply transformation and normalization techniques to prepare datasets.
  • https://docs.google.com/presentation/d/e/2PACX-1vStY41yXKB-bMoHDF2Kup8fA7Z0VBSX5mZOqP72Jl0Xznsi85FCjPTJXgE5LF0ZOw/pubembed
2.00 hrs
Exploratory Data Analysis in Python
Perform exploratory analyses and generate summary statistics using Python tools. Create initial visualizations to uncover patterns and anomalies.
  • https://docs.google.com/presentation/d/e/2PACX-1vSplzyWfRZ1HxKqdORCzuyVU5rhwGTKjGKcDfCMYDzOVdmJIg616OvM8amjzl8eEQ/pubembed
2.00 hrs
Scripting and Reproducibility
Organize Python code into reusable scripts and functions for reproducible workflows. Use simple versioning and documentation practices to maintain analyses.
  • https://docs.google.com/presentation/d/e/2PACX-1vR-53O4YYclGuFlaK_l1a6OFTmgAXizsiBbvso7LVRmLYFV8Srs2YcKdz3JMIUkyw/pubembed
2.00 hrs

Excel Fundamentals for Analysis
Navigate Excel interfaces and use basic formulas and functions for data tasks. Organize data effectively using tables and basic formatting.
  • https://docs.google.com/presentation/d/e/2PACX-1vRpU6O6Lnuct3T0EDN3_25ONZs2CQ4oHlasfRusf7c_Qtpsz8Y0fZ__KDYOVw703Q/pubembed
2.00 hrs
Data Cleaning and Transformation in Excel
Use Excel tools like Text to Columns, Find & Replace, and Flash Fill to clean data. Apply functions and techniques to transform datasets for analysis.
  • https://docs.google.com/presentation/d/e/2PACX-1vS-gDR0GiesAQrnBH4smtdt86m800UYOrBv4dkzvtipuud0OP7s_lJeQsuDfCBvdQ/pubembed
2.00 hrs
Advanced Formulas and Functions
Use lookup, conditional, and aggregation functions to derive insights. Combine functions to create dynamic and reusable calculations.
  • https://docs.google.com/presentation/d/e/2PACX-1vRR0lhWbi3qxDaYv7DZVAlTH_GKvvKjhiNPkzQxPSzbQ-D7m3-DwNfi9mQ8X70BKw/pubembed
2.00 hrs
Pivot Tables and Summarization
Create and customize pivot tables to summarize and explore large datasets. Use pivot features to calculate subtotals, filters, and groupings.
  • https://docs.google.com/presentation/d/e/2PACX-1vS35p7xDUsUnkkhfJepdmrcqX6VmkSSk0n-j8PRwxADF1-KbpcBIlPlg8ZxB9eilw/pubembed
2.00 hrs
Excel Visualization and Reporting
Build charts and conditional formatting to highlight key trends and outliers. Design reporting sheets that communicate findings clearly.
  • https://docs.google.com/presentation/d/e/2PACX-1vQSzCPtp6g1E1ye6XdIphkAiC0X75iVkf5B1gMbjuEE5lxZzR7oYRP_Qr4MD_7VUQ/pubembed
2.00 hrs
Automation with Macros Basics
Record and run simple macros to automate repetitive Excel tasks. Understand basic macro editing to adapt recorded workflows.
  • https://docs.google.com/presentation/d/e/2PACX-1vQXY9zBRsrDgnYD_ik82149sebudJg7pMlJKxar6OH0DH2cYasRtfAnQUe_X1rwXg/pubembed
2.00 hrs

Relational Database Concepts
Explain tables, keys, and relationships in relational databases. Understand how schemas structure and constrain data.
  • https://docs.google.com/presentation/d/e/2PACX-1vS-GQARm8lmFgDgPdGgB-SeFMIaHBwOheTHQ2638ij337sQ4TdHZBc4_VzArC4XmA/pubembed
2.00 hrs
Basic SQL Queries
Write SELECT queries to retrieve data and apply filtering with WHERE clauses. Use ORDER BY and DISTINCT to refine result sets.
  • https://docs.google.com/presentation/d/e/2PACX-1vRiLun4k6YkHPHZ6oa4aT9KQpHrQOJZAQHPWDpjkOpIi9Jg3xcDj5z94glzl-p-_w/pubembed
2.00 hrs
Joins and Subqueries
Perform inner, left, right, and full joins to combine data from multiple tables. Use subqueries to structure complex data retrieval tasks.
  • https://docs.google.com/presentation/d/e/2PACX-1vTsERqxodtPJZQSeINBeHSijxYgNtZHNqRzqYcVmMFqiMJr8uNBK7DY2zlsuU3iJg/pubembed
2.00 hrs
Aggregation and Grouping
Use GROUP BY and aggregate functions to summarize datasets. Apply HAVING filters to control aggregated results.
  • https://docs.google.com/presentation/d/e/2PACX-1vTVgXPl78RlCnUMippihis3kYVmRsbMxeC1u5PM1ZUV22mHJMD5tsu2uPJrupZSXw/pubembed
2.00 hrs
Window Functions and Advanced SQL
Apply window functions for running totals, rankings, and moving calculations. Use advanced querying techniques for analytical tasks.
  • https://docs.google.com/presentation/d/e/2PACX-1vR82CBjx2dwewZQbB6k6lbrDbFz5MgqgZB2KXeHvhs-M3LnmX_6db_z-ZIqfBd72w/pubembed
2.00 hrs

Supervised vs Unsupervised Learning
Differentiate supervised and unsupervised learning paradigms and their use cases. Identify common algorithms for each approach.
  • https://docs.google.com/presentation/d/e/2PACX-1vStqH3Z1CBjpYbA8T5NVt2LGQJbZdssivUSSpk6hQeXRp7nZE52BeanGxx36R1f-g/pubembed
2.00 hrs
Regression Techniques
Explain linear regression principles and interpret model coefficients. Evaluate regression model performance using standard metrics.
  • https://docs.google.com/presentation/d/e/2PACX-1vQ88fU9s4dBIQJNodo1vCTtyZ2gvgB2VrZ73erb0abKcBlpBhBe4TU2YKdaJEdNEQ/pubembed
2.00 hrs
Classification Methods
Describe common classification algorithms and evaluate models with confusion matrices and accuracy metrics. Apply basic techniques to classify labeled data.
  • https://docs.google.com/presentation/d/e/2PACX-1vQkhER4joc4CFBs4oEZmShxu-FuB0n8NF6ST5uqVqAjIH3SwWI_L5NrRrADmEt3rg/pubembed
2.00 hrs
Model Evaluation and Validation
Use train-test splits and cross-validation to assess model generalization. Interpret evaluation metrics to guide model selection and tuning.
  • https://docs.google.com/presentation/d/e/2PACX-1vTKMebcVzmRu2-twi4q2X8Qccvji4698oF_1hUNaVttTW_X7ilSaS4eT9RG8OwjRg/pubembed
2.00 hrs
Feature Engineering and Selection
Create and transform features to improve model performance. Apply selection techniques to reduce dimensionality and overfitting risk.
  • https://docs.google.com/presentation/d/e/2PACX-1vSOUmCq3oQfBCx5sfIagUDjGSkIuSFHaIPFO6Vu8OFuPRNEQpCVqDbBop9mAUzBVA/pubembed
2.00 hrs
Introduction to Model Deployment
Outline the steps to deploy simple models and integrate them into data workflows. Consider monitoring and maintenance needs for deployed models.
  • https://docs.google.com/presentation/d/e/2PACX-1vTOgVhmX3exHqlbvgAFZlVI8-kjVhrCsWRISpZ-71QJ7xv4gWXDSIogsvY1ZU2Dsg/pubembed
2.00 hrs
Ethics and Responsible ML
Identify ethical concerns like bias and privacy in machine learning applications. Apply best practices to mitigate unfair or harmful model behavior.
  • https://docs.google.com/presentation/d/e/2PACX-1vSpXBfQ6dIQXqoQRXzqyvD9zOzv0ZXHsAl18oybj1BINaQvq1KJt9Kl5gu9_99Fpw/pubembed
2.00 hrs

Project Scoping and Data Acquisition
Define project goals, success metrics, and required data sources. Acquire and document datasets needed for the case study.
  • https://docs.google.com/presentation/d/e/2PACX-1vTEQ7FqA7oEIfYeAphA_eZbcxg0iy9bvUAtEKqMwFClZGCLmkv40KrartPGda_lXg/pubembed
2.00 hrs
Data Preparation and Exploration
Prepare the project dataset with cleaning and transformation steps. Conduct exploratory analysis to identify key patterns and hypotheses.
  • https://docs.google.com/presentation/d/e/2PACX-1vQubs7iQ1KV50YCddEZSmgtnGRxSHt9qVsPQRDFiVxbY4AKlk-5ALaKsmgXkZT4iQ/pubembed
2.00 hrs
Analysis and Modeling
Apply appropriate analytical techniques or models to address the project question. Iterate on methods based on evaluation and diagnostics.
  • https://docs.google.com/presentation/d/e/2PACX-1vSoJnYnc8_Kx9Co30w5aMStCOWvSzDTPu2pfkLbEcgHxzmTsk5kj5XeMwXyUtPJCA/pubembed
2.00 hrs
Visualization and Reporting
Create clear visualizations and a report that communicates findings and recommendations. Tailor presentation to intended stakeholders and decision contexts.
  • https://docs.google.com/presentation/d/e/2PACX-1vShaLQ_3ArejsMPaPRQzx9ttS9fNfrqCLFhfiROKpGLyhhrSpuT0XpFPJNKI_5WwA/pubembed
2.00 hrs
Final Presentation and Reflection
Deliver a concise presentation of your project approach, results, and business implications. Reflect on lessons learned and areas for further improvement.
  • https://docs.google.com/presentation/d/e/2PACX-1vR2B88S8XjNsqVJ9qMtsysPfFm5Y1amASDlR_xAK9-fJD_x_I0mkhRqcqUxTrGizw/pubembed
2.00 hrs
Upcoming Batches

Pick a schedule that fits your routine

We run multiple live cohorts so you can line up a batch with your goals, weekly bandwidth, and preferred mode of learning.

Weekend Batch Filling fast

Starts 27 Sep 2025

  • 08:00 AM - 10:00 AM
  • Morning Batch
  • SS cadence
  • 45 live sessions
Weekend Batch

Starts 27 Sep 2025

  • 08:00 PM - 10:00 PM
  • Evening Batch
  • SS cadence
  • 45 live sessions
Weekday Batch

Starts 29 Sep 2025

  • 08:00 AM - 10:00 AM
  • Morning Batch
  • MWF cadence
  • 45 live sessions
Weekday Batch

Starts 29 Sep 2025

  • 08:00 PM - 10:00 PM
  • Evening Batch
  • MWF cadence
  • 45 live sessions
Weekend Batch

Starts 04 Oct 2025

  • 08:00 AM - 10:00 AM
  • Morning Batch
  • SS cadence
  • 45 live sessions
Weekend Batch

Starts 04 Oct 2025

  • 08:00 PM - 10:00 PM
  • Evening Batch
  • SS cadence
  • 45 live sessions
Learner Voices

Stories from professionals who accelerated with SkillsBiz

Hear how learners leveraged mentor feedback, immersive projects, and certification support to reach their Mandarin goals.

T
Tanvi Sharma
My learning journey at Skillsbiz was excellent. The Data Analytics course was structured with theory, practice, and projects. The assignments helped me test my skills, and the trainer’s support made everything easy to follow. I highly recommend this course to beginners.
R
Ritika Menon
The course gave me a strong foundation in analytics with step-by-step guidance. I liked how each concept was tied to business problems and practical examples. The capstone projects were very helpful in building confidence. It’s a great platform for learning analytics.
A
Aishwarya Singh
Joining Skillsbiz for Data Analytics was the right choice. The trainers made technical topics simple and gave us constant guidance. The live projects were challenging but fun, and they helped me understand real-world applications. I now feel ready for analytics jobs.
K
Kunal Verma
The Data Analytics training gave me exactly the exposure I needed. From data cleaning to visualization, everything was taught with practical examples. I particularly enjoyed learning Power BI dashboards, which I am now using in my job. It has definitely given me a career edge.
A
Aditya Menon
As a beginner, I was worried if I could cope with analytics, but Skillsbiz made the concepts simple and easy. The trainer patiently clarified all doubts and guided us through exercises. I now feel comfortable working with data and even preparing dashboards on my own.
R
Rahul Khanna
I enrolled in the Data Analytics course at Skillsbiz and it was a great learning journey. The trainer explained concepts step by step, from basics of Excel to advanced visualization techniques. The assignments were practical and helped me apply everything I learned.
Frequently Asked Questions

Your questions, answered in one place

Everything you need to know before you commit—from certification timelines to support during the program.

The course lasts for 90 hours.
The price of the course is INR 29,500.
Some prior experience with data and statistical concepts is beneficial but not required.
Yes, you will receive a certificate upon successfully completing the course.
The course is taught in English.
Yes, there are several hands-on projects, including a final case study.
Yes, you will have lifetime access to the course materials.
You will learn to use tools like Excel, Python, SQL, and data visualization software.
This course is designed for intermediate learners, but beginners with a strong interest in data can also benefit.
The course is delivered online through a mix of video lectures, reading materials, and interactive exercises.

Global recognitions that power your profile

We are trusted by leading accreditation bodies, ensuring your certificate is respected by employers worldwide.

Nasscom Certification ISO Certification MSME Certification ISO 9001 Certification Startup India Certification EU Certification MCA Certification Future Skills Certification
Awards & Recognitions

Celebrated for excellence in outcome-driven education

Our pedagogy, learner outcomes, and mentor network have been acknowledged by industry councils and global education forums.

Award 1
Award 2
Award 2
Award 2

Ready to fast-track your Professional Data Analyst Certification Program mastery?

Join a live cohort, collaborate with peers, and unlock premium resources designed for global careers.

Explore Schedules
Call WhatsApp